In recent years, the development of program-algorithmic base of electric exploration had an impact on the ways of field data interpretation. The software is responsible for the result. A formal approach to the data interpretation is a plus by many organizations, and departure from the standard of the count in every way possible suppressed. Such approach to interpretation is untenable because of some properties of inverse modeling. The visionless relevance of the interpreter to the algorithm output can lead to the inadequate results, which compromise geophysics in front of geologists. The inversion algorithm is like a “black box” – the quality of the results depends on the priori information.
Usually the interpretation begins with data analysis and primary data processing. Always there is a rule – “qualitative interpretation begins with the qualitative data”. It is impossible to overestimate the importance of qualitative analysis of observed data. Sometimes, even a small percentage of bad data can affect the resulting model. The dispersion of measurements is important for the data interpretation. Knowledge of dispersion estimator allows setting the correct weight of each measurement during inversion. It is useful to use iterative robust scheme for evaluation of data’s quality. These schemes should be applied in case of variation from the normal distribution of errors, spikes and etc. This algorithm applied to some sample data by different methods. For example, during interpretation of cross-borehole survey it is better to use robust scheme for the data in each of the source position separately.
Except industrial and instrumental method interferences is geological noise. It is known as P or C-effect. It appears when potential or current electrode falls on the local near-surface irregularity. The electric field strongly changes due to the irregularity. As a result, the sounding curve shifts without changing form (VES, MT). A lot of articles are dedicated to methods of controlling the geological noise. We propose the following algorithm to control the P-effect. It can be used during one-dimensional data interpretation.
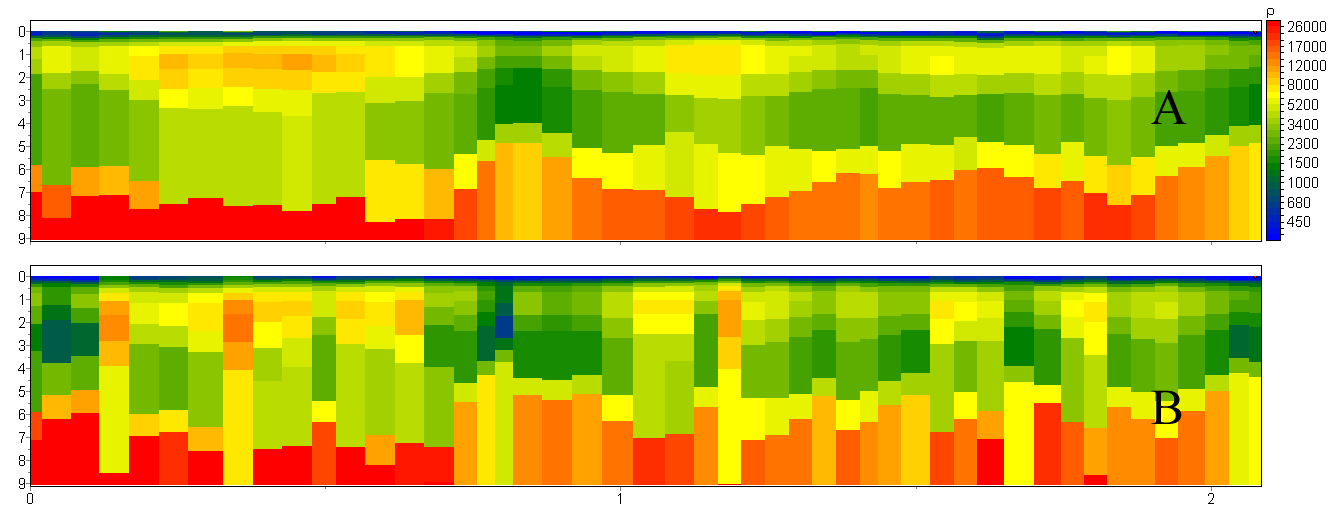 Picture.1. Comparison of one-dimensional inversion results of electromagnetic sounding profile data according to the proposed (A) and standard (B) methods obtained with the use of ZondMT1D.
Parameter which modeling P-effect add to each curve during the two-dimensional interpretation of MTS data. Geological noise makes the strongest distortions in the data of cross-borehole tomography. During two- or three-dimensional inversion anomalous substance is formed in borehole environment. This substance is not associated with the real geological situation. Tramps, which are controlling by the borehole, separate the earth into loose area. In consequence, parameters are changed or the layers shift on different sides of the borehole. This complicates the geological interpretation of electrotomography results.
For solving this problem is proposed method, which allows to improve inversion results. The algorithm is to use a non-standard smoothing operator. The operator is constructed in such way that to produce through average of non-contiguous cells with borehole.

Picture.2. Comparison of inversion results of electromagnetic sounding synthetic data for model (A) according to the proposed (B) and standard (C) methods obtained with the use of ZondCHT.
During two-dimensional interpretation we should use the special algorithms, if the geoelectrical earth is complex. The complex earth is the earth, where angels of thin layers change or there are several structural levels within the one model. The standard inversion of this model is very rough and the result is not real. We developed the algorithm, which set up any averaging direction of smoothing operator for the different parts of model.
The next important way of quality improvement is adding the log data. The log data can be used in a qualitative or quantitative form. Resistivity log data allows locking or setting intervals range of changing in resistivity for cells along the borehole. Because of that the inversion results improved.

Picture.3. Comparison of inversion results of synthetic RMT data for model (A) with (B) and without (C) log data obtained with the use of ZondMT2D.
Undoubtedly, the best way of interpretation is the integration of geophysical methods. The some geophysical method is the most suitable for some modeling. To get all geological information, we should evaluate results jointly, because of possibility of each method to detect the different geological object. The quantitative integration method is based on special algorithm of focus inversion. The focus inversion is the modification of Occam, which allows to get sectionally-smooth parameterization. For an example, the cover thickness of rock foundation is known according the seismotomography. During electrotomography inversion the focus filter is used. This filter based on this boundary information.
Sometimes, model obtained by smooth inversion, we need to transform to structured geoelectrical model. This model consists of small amounts of objects. In order to do this we use polygonal interpretation. This is the more geological approach of data interpretation.

Picture.4. An example of structured geoelectrical model obtained with the use of ZondRes2dp.
In addition, there are algorithms of sequential interpretation of electrical and electromagnetic data. Result’s quality improvement depends on different sensitivity of electrical and electromagnetic methods to the parameters of geoelectrical models. Equivalent solution reduced due to the sequential interpretation.
There are many methods of data interpretation. This work is devoted to the methods, which are used more frequently during interpretation.
No comments:
Post a Comment